Advanced OLED Simulation Software
1. Introduction
OghmaNano provides an advanced OLED simulation framework for modelling organic light-emitting diodes using a self-consistent multi-physics approach. The simulator combines charge transport, recombination, optical outcoupling, and emission modelling within one framework, allowing the internal operation of OLED devices to be resolved in detail.
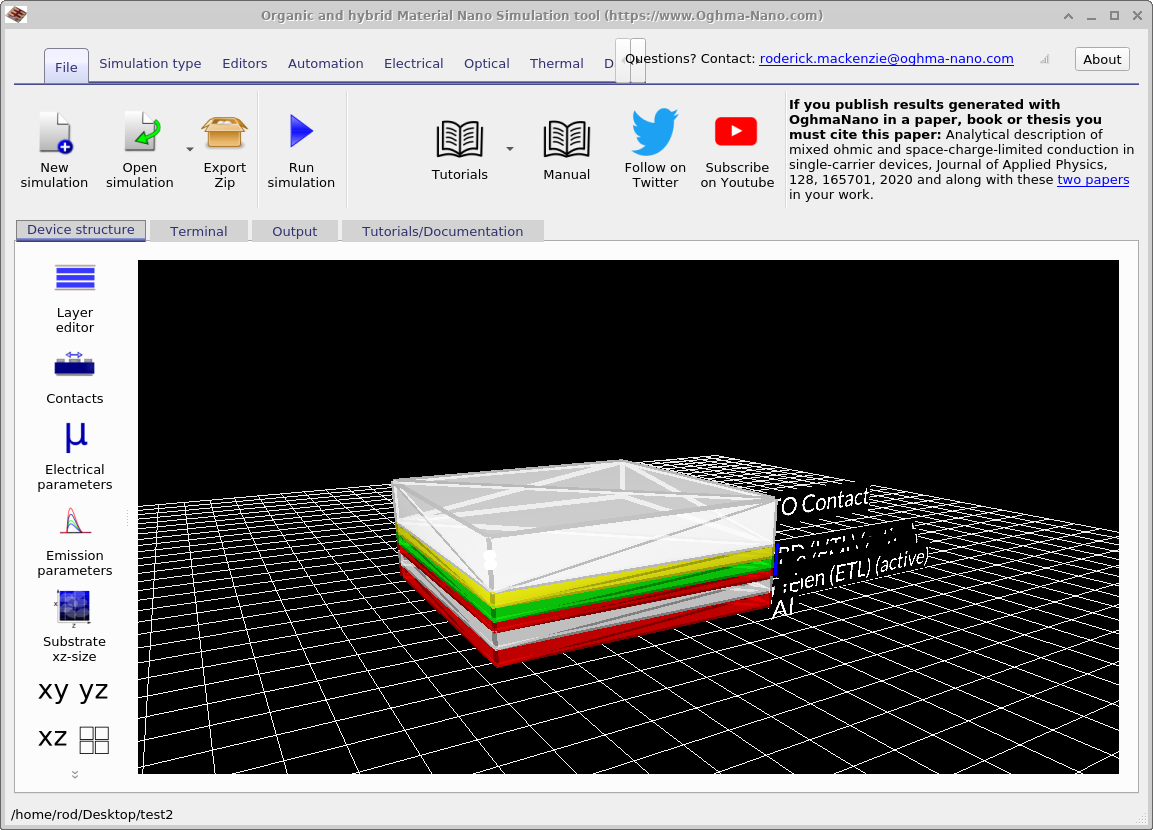
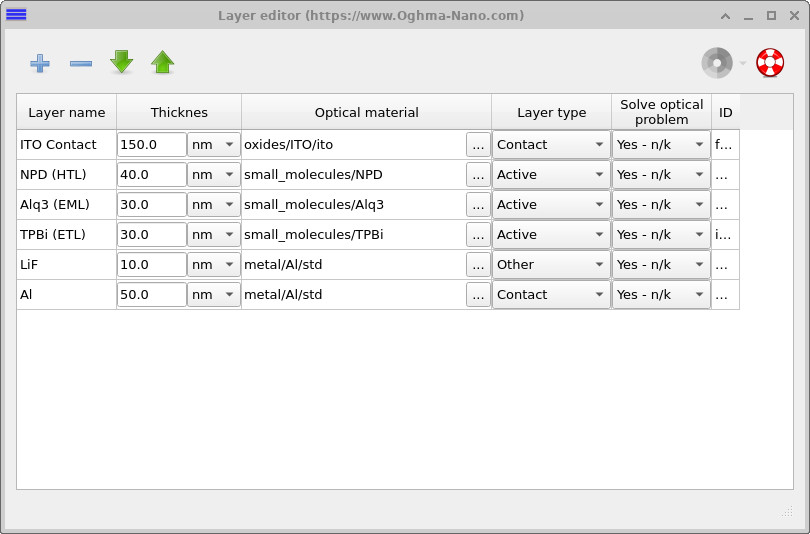
Rather than treating the device as a black box, OghmaNano allows users to understand how layer structure, energetics, injection barriers, mobility balance, recombination, and thin-film optical interference determine the final electrical and optical response. This includes the position of the emissive region, the distribution of electrons and holes, the output spectrum, the EQE, and the resulting colour. The main simulation workflow is illustrated in Figure ??, while the OLED stack itself can be edited directly using the layer editor shown in Figure ??.
The same framework can be used for steady-state, transient, and AC simulations in 1D, 2D, and 3D geometries. A guided walk-through is available in Figure ??, and the full tutorial can be found in Part A: OLED device simulation – coherent thin-film optics.
✨ What you can do with OghmaNano
- Simulate full OLED operation: model charge injection, transport, recombination, and light emission in a single self-consistent device simulation.
- Resolve electro-optical coupling: use the recombination profile from the electrical solver as the emissive source for the optical model.
- Calculate optical outcoupling: study escape probability, cavity effects, and wavelength-dependent emission using coherent thin-film optics.
- Examine spectra and EQE: simulate voltage-dependent luminance, EQE, and emission spectra directly.
- Track colour stability: compute CIE coordinates and study voltage-dependent colour shifts caused by cavity effects and recombination-zone movement.
- Explore device design: vary layer thicknesses, transport properties, emission efficiency, and recombination location to understand what limits performance.
- Compare directly with experiment: interpret I–V–L, EQE, and spectral measurements using a physics-based model rather than empirical fitting alone.
Try an OLED example.
👉 Start with the OLED tutorial (Part A) for coherent thin-film optics, or move on to Part B for ray tracing and angle-dependent emission.
2. Why OLED simulation needs a multi-physics model
OLED performance is governed by a strong coupling between electrical transport and optical output. The current alone is not enough: the internal carrier distribution determines where recombination occurs, how efficiently photons are generated, and how much of that light escapes from the multilayer stack. Small changes in mobility balance, injection barriers, recombination-zone position, or layer thickness can significantly change efficiency and colour.
This is why physically realistic OLED modelling requires more than a simple equivalent-circuit description. OghmaNano resolves the internal device state directly, allowing users to separate transport limitations, recombination losses, emission efficiency, and optical outcoupling effects rather than folding them into empirical fitting parameters.
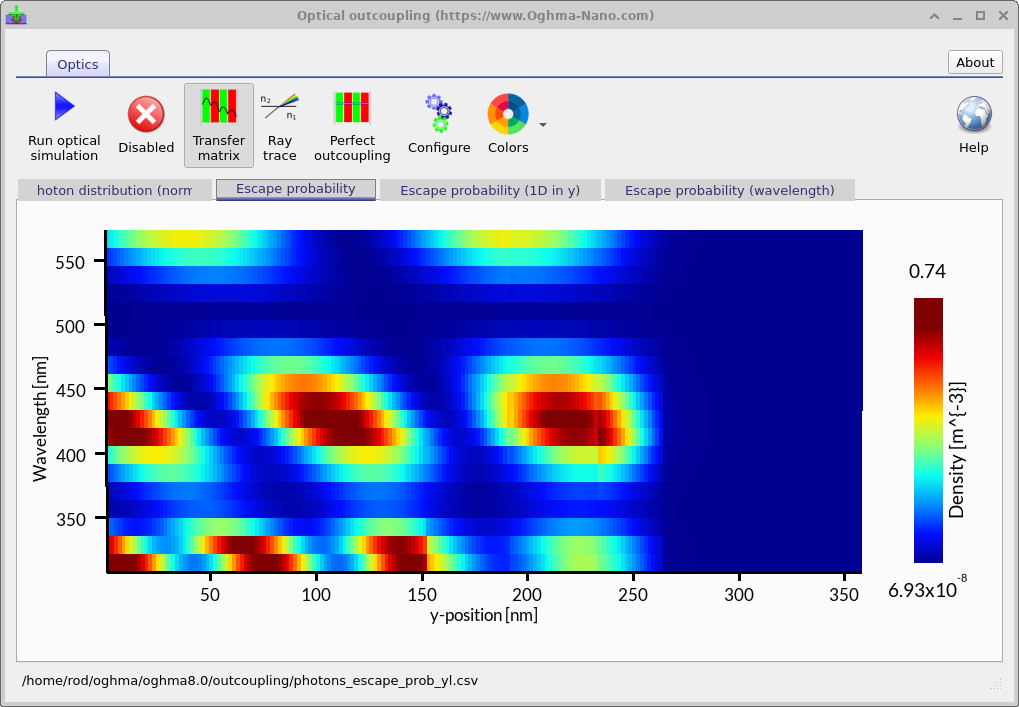
The optical outcoupling calculation can be inspected directly, as shown in Figure ??. This map shows how escape probability depends on both wavelength and position within the device, making the role of cavity effects immediately visible.
3. Combined electrical and optical OLED simulation
In OghmaNano, the OLED optical model can be coupled directly to the electrical drift–diffusion simulation. In this workflow, the recombination profile from the electrical solver acts as the emissive source for the optical calculation, enabling prediction of both current–voltage behaviour and optical output from the same simulation.
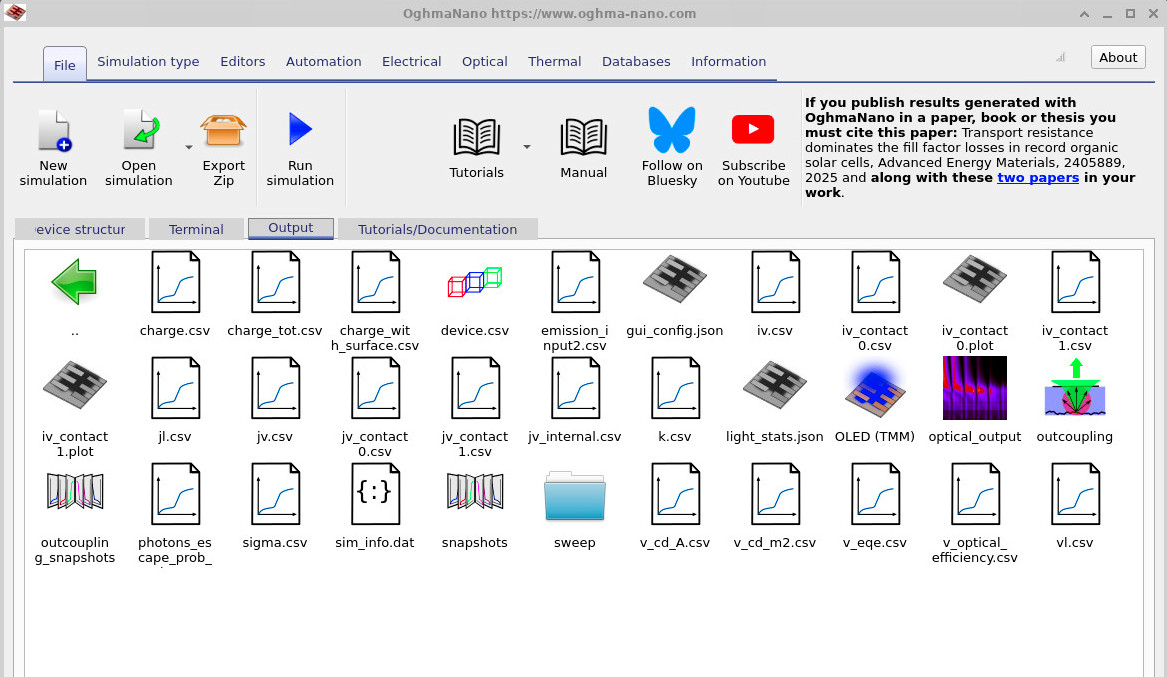
The resulting outputs include current density, luminance, EQE, luminescence spectra, and colour-related quantities. A typical result set is shown in Figure ??, where the combined electro-optical simulation writes the relevant files to the output browser for further analysis.
This makes it possible to connect what is happening inside the OLED — injection, transport, carrier overlap, and recombination — to what is measured outside the device.
4. Spectra, EQE, and colour
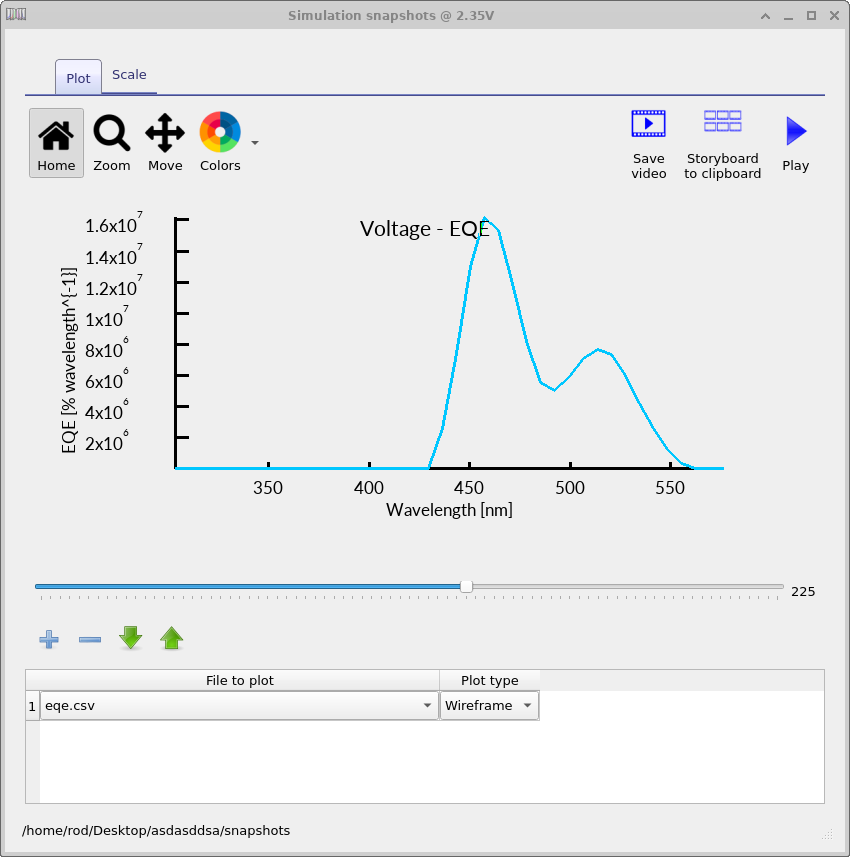
One of the most useful aspects of OLED simulation is the ability to study how the emitted spectrum and EQE evolve with voltage. As the recombination zone shifts within the optical cavity, different parts of the emission spectrum are coupled out with different efficiencies, which can lead directly to voltage-dependent colour shifts.
This behaviour can be inspected through the calculated EQE spectrum shown in Figure ??. In OghmaNano, these spectral outputs can be combined with CIE calculations to track chromaticity as a function of operating voltage.
Useful next steps include the OLED tutorial (Part A), the ray-tracing OLED tutorial (Part B), the wider drift–diffusion theory section, and excited states and emission processes.