Gain deeper insight into your experimental data by using OghmaNano to simulate
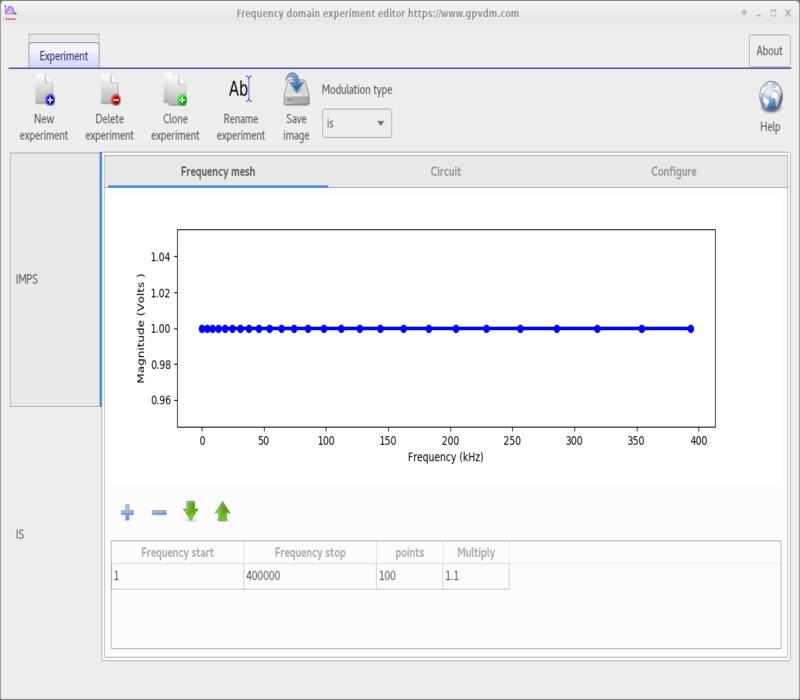
Intensity Modulated Photocurrent Spectroscopy (IMPS) and
Impedance Spectroscopy (IS).
These tools allow you to explore how key physical parameters — such as charge carrier mobility, trapping, recombination rates, and parasitic circuit elements — influence the frequency response of your device.
Apply either voltage or light modulation and observe how the resulting current and voltage vary with frequency.
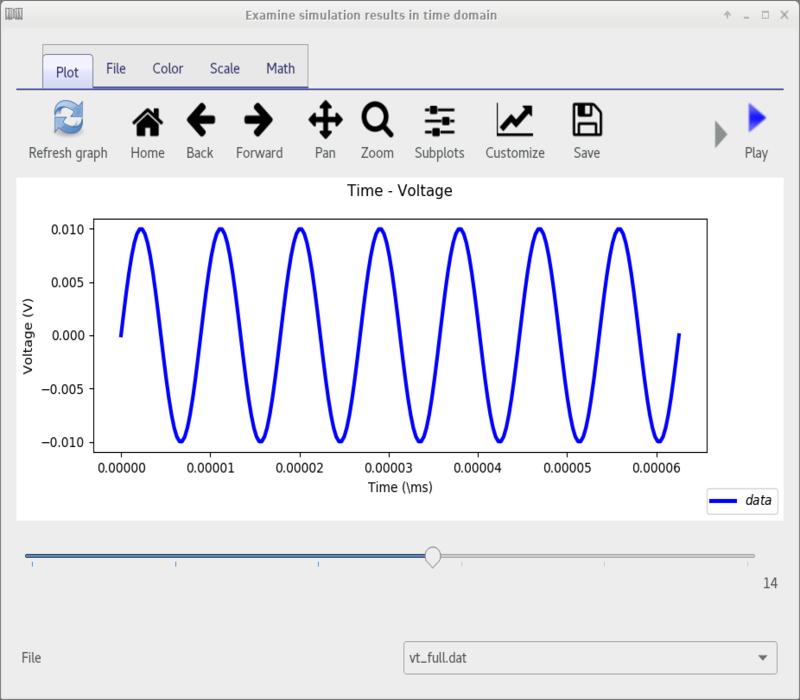
Switch seamlessly between frequency-domain analysis and time-domain transients to visualise how phase and amplitude evolve over time.
This dual perspective helps you connect the dynamic processes in your device to its measured frequency response.
Key Features:
Intuitive, quick simulation setup for IMPS and IS measurements.
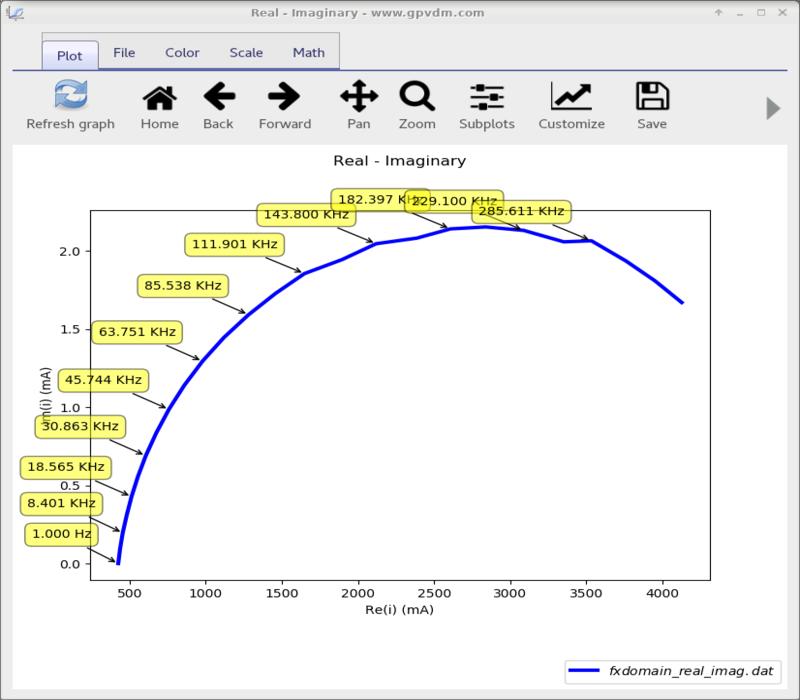
Nyquist plots (Re(i) vs. Im(i)) for visualising complex impedance behaviour.
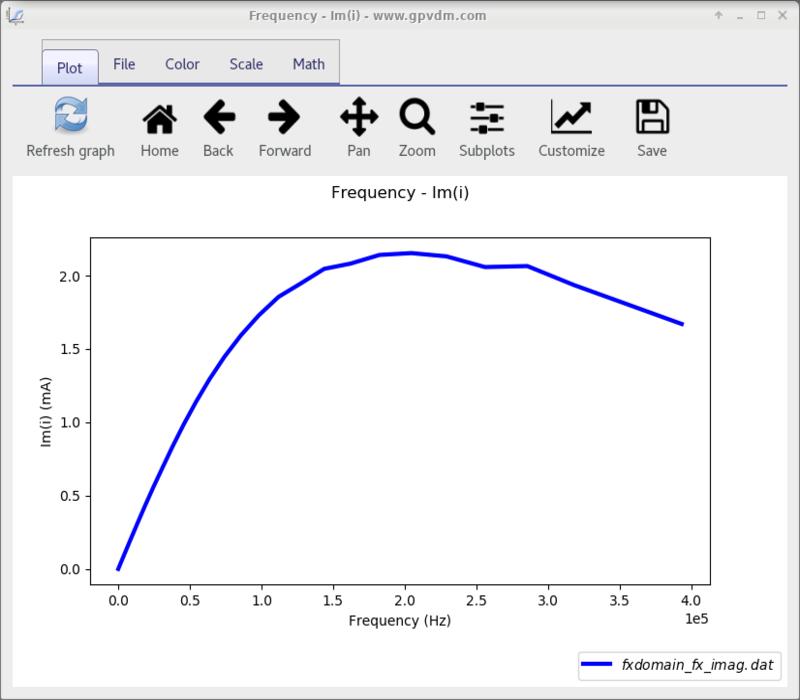
Bode-style plots (Frequency vs. Re(i) and Frequency vs. Im(i)) for magnitude and phase analysis.
Examine results in both frequency domain and full time-domain transients.
Rapid switching between IMPS/IS simulations and JV (current–voltage) simulations on the same device structure.
Compatible with both light- and voltage-modulated measurements.
SRH trap modelling — simulate the influence of Shockley–Read–Hall defect states on frequency response, including trap density, energy level, and capture cross-section effects.
Temperature-dependent frequency sweeps to study how mobility, recombination, and trapping evolve under different operating conditions.
Batch processing mode for running multiple sweeps at different bias voltages, illumination levels, or device configurations in one automated run.
Export to standard formats such as CSV for analysis in MATLAB, Python, or specialised fitting tools like ZView.