Output Probes in OghmaNano
What are probes?
Often during a simulation you want to monitor a specific point within the device as a function of simulation step. For example, you may want to monitor the conduction band, carrier density, or electric field at a particular mesh point as a function of voltage or time.
One way to achieve this would be to use the snapshot system, write all simulation snapshots to disk, and then use an external MATLAB or Python script to extract the required point from each output file. This is often a powerful approach because it gives complete access to the full simulation state.
However, a much quicker method is to use output probes.
Output probes effectively intercept simulation output files before they are written to disk, extract a specific value from the dataset, and then automatically build a new plot as a function of simulation step.
For example, if the simulation generates the file:
Ec.csv
which contains the conduction band energy profile through the device, a probe can intercept that dataset, extract the value at a single mesh point, and automatically construct a new dataset showing how that value changes as a function of voltage or time.
In practice, this allows quantities inside the device to be monitored continuously without needing to manually process large snapshot directories.
Configuring probes
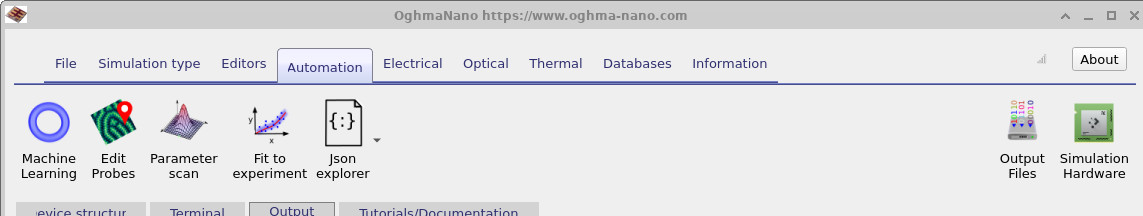
The probes editor can be opened from the Automation ribbon shown in ??.
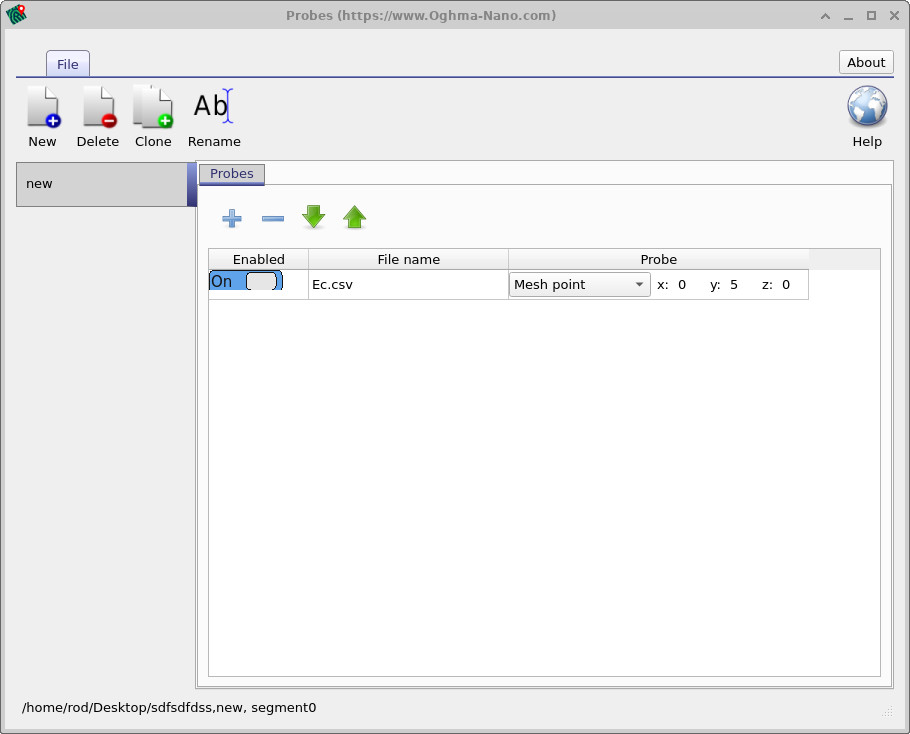
In this example the probe is monitoring the file:
Ec.csv
which corresponds to the conduction band energy profile within the device.
The probe is enabled and configured to extract the fifth mesh point along the y-axis. In this example the device is one-dimensional and contains ten mesh points, meaning the probe is extracting the value located approximately halfway through the device.
Probes are not limited to extracting single mesh points. They can also be configured to calculate average values, minimum values, maximum values, and other reduced quantities depending on the type of analysis required.
Conceptually, probes operate by monitoring files being written during the simulation and automatically extracting quantities from them to generate another continuous plot.
Probe output
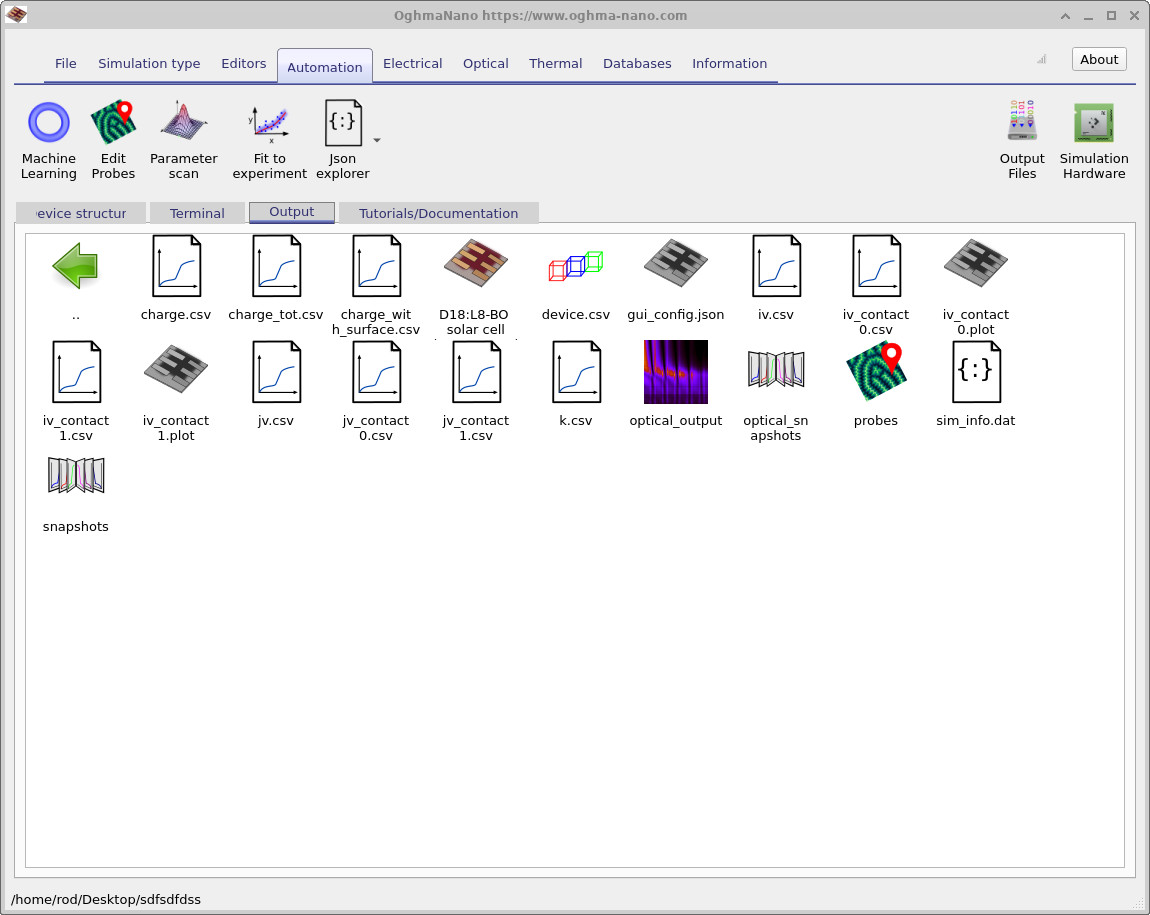
Once the simulation has been run, a probes directory will appear in the simulation output browser, as shown in ??.
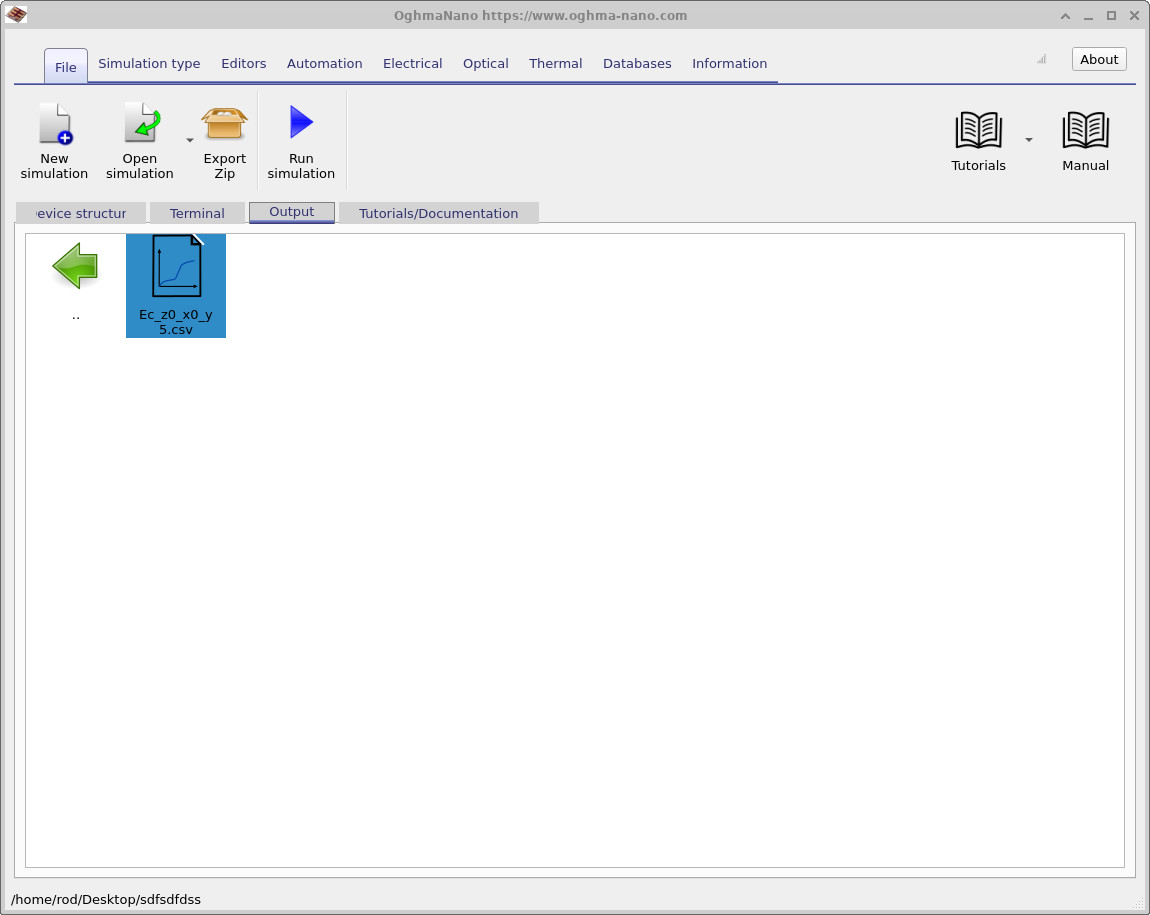
In this example the generated file is:
Ec_z0_x0_y5.csv
which corresponds to the conduction band energy extracted at the mesh point:
z=0, x=0, y=5
If this file is opened, OghmaNano automatically plots the monitored quantity as a function of simulation step, as shown in ??.
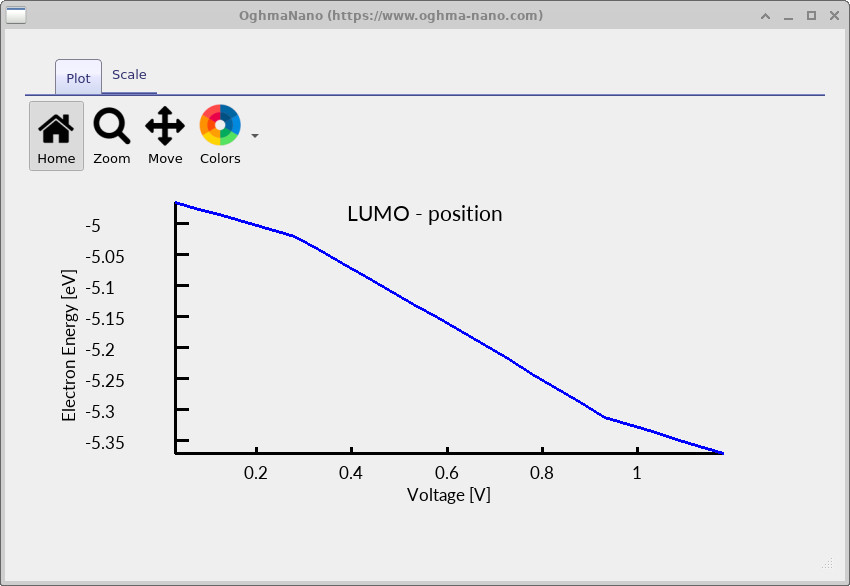
Using probes in this way allows quantities such as potentials, carrier densities, recombination rates, and electric fields to be monitored continuously at specific locations inside the device.
Because probes automatically reduce the datasets during the simulation itself, they avoid the need to manually process large numbers of snapshots using external scripts.
Internally, probe outputs use the same OghmaNano output format as all other simulation outputs and can therefore be stored either in human-readable CSV form or compact binary form.
💡 Tip: Probes are particularly useful when monitoring quantities at interfaces, contacts, or specific regions inside large transient or drift–diffusion simulations.